Log Services
DreamFactory 2.3.1 introduced the Log services. With Log services you can use a simple REST API to log any activities directly from your application or from DreamFactory platform using scripting services. The Log service currently supports integration with Logstash.
Contents
Logstash
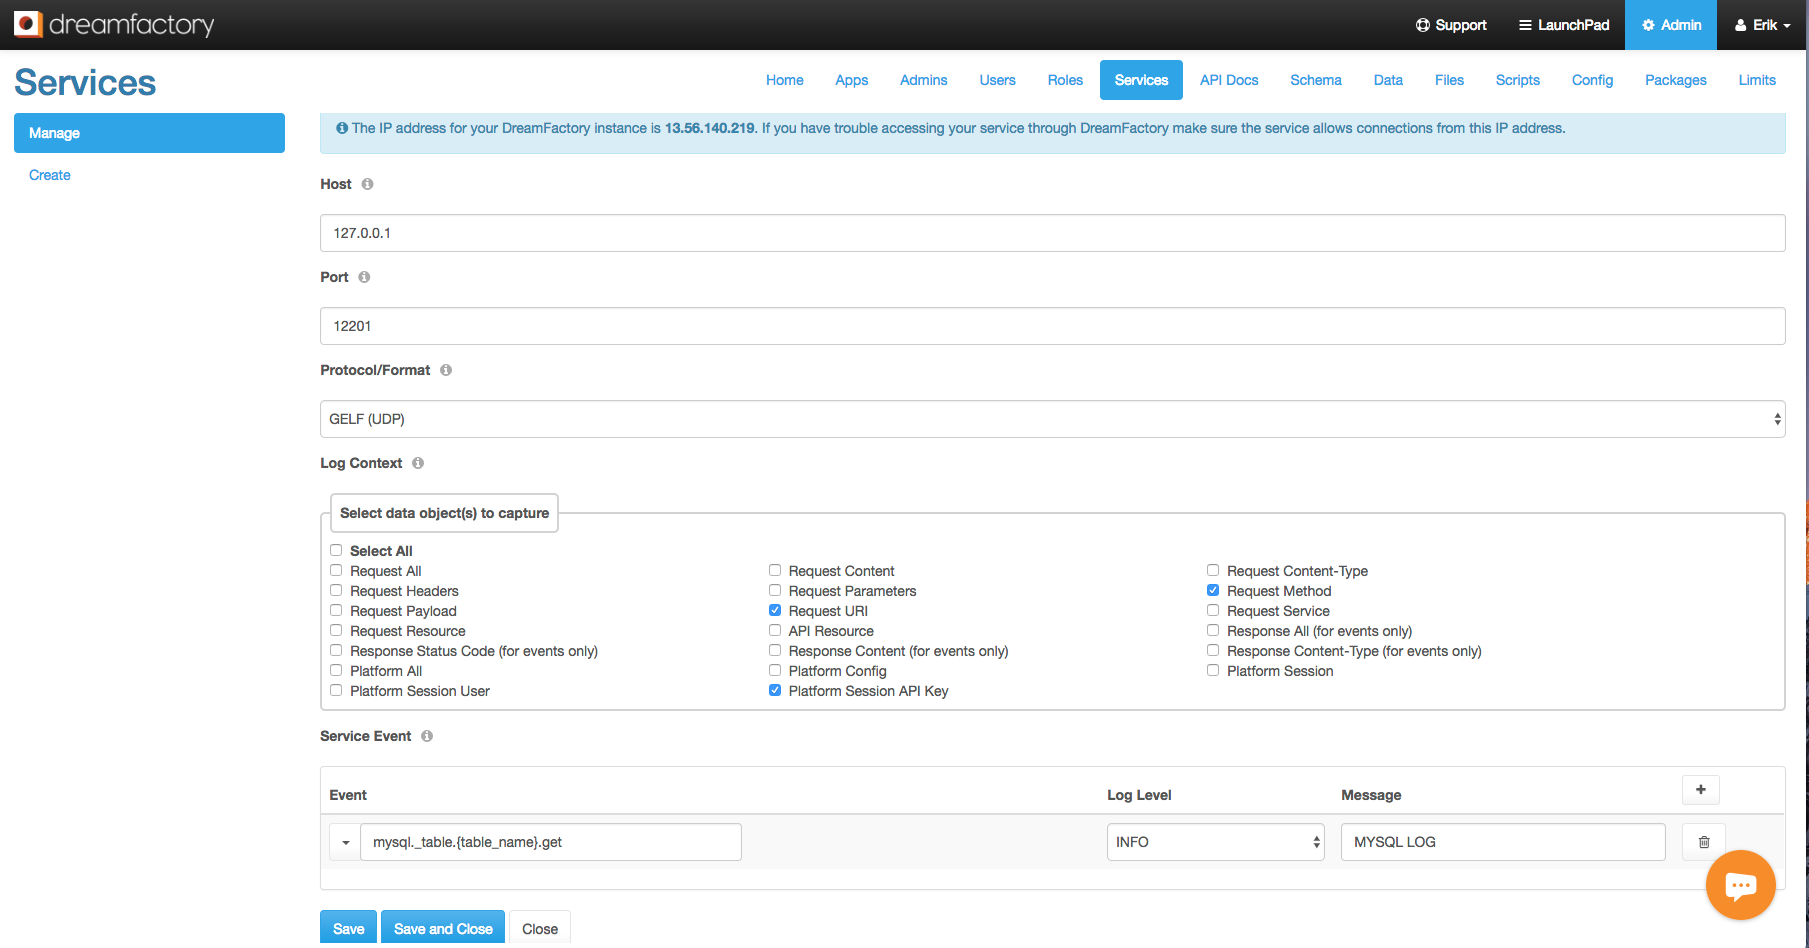
The Logstash Log service allows you to easily connect your DreamFactory instance to a Logstash service listening for input on UDP, TCP, or HTTP protocol. Once you create a DreamFactory Logstash service, you can POST all your application and/or custom DreamFactory logs (via scripting) to Logstash. This gives you the ability to utilize the powerful Elasticsearch and Kibana for data analysis and reporting purposes. Logstash is a native DreamFactory service and is supported by features such as role-service-access, lookup usage, live API documentation, and caching.
Configuration
Logstash log service is managed via the api/v2/system/service API endpoint under the system service and have the service_type
logstash. You can retrieve the full service type information using the API api/v2/system/service_type/logstash.
Below is the format of a typical Logstash service configuration.
{
    //Choose a URL safe service name
    "name": "logstash",
    //Choose a label for your service
    "label": "logstash",
    //A short description of your service
    "description": "log",
    //Boolean flag to activate/inactivate your service
    "is_active": true,
    //Service type
    "type": "logstash",
    "config": {
        "host": "127.0.0.1",
        "port": 5699,
        "protocol": "udp"
        "context":[
            "_platform.session",
            "_event.response.status_code",
            "_event.request"
        ],
        "service_event_map": [
            {
                "event": "system.admin.session.post",
                "level": "ALERT",
                "message": "Admin Login"
            },
            {
                "event": "system.admin.session.delete",
                "level": "ALERT",
                "message": "Admin Logout"
            }
        ]
    },
}
The following describes the configuration elements of the Logstash service type.
Host
String. Required. IP Address/Hostname of the machine running the Logstash service.
Port
Integer. Required. Port number that Logstash is listening on for inputs.
Protocol
String. Required. Network protocol/format that Logstash input is configured for. Supported options are GELF (UDP), HTTP, TCP, UDP
- GELF (UDP) - Choose this if your Logstash service is configured to accept GELF format - http://docs.graylog.org/en/2.1/pages/gelf.html.
- HTTP - Choose this if your Logstash service is configured to listen on HTTP protocol. Data is sent using JSON format.
- TCP - Choose this if your Logstash service is configured to listen on TCP protocol. Data is sent using JSON format.
- UDP - Choose this if your Logstash service is configured to listen on UDP protocol. Data is sent using JSON format.
Context
Array. Optional. Log contexts are data objects like Requests, Response, Platform information etc. These are the additional system data that are reported with your log message so that you can have a better context (system state) of your log message. Here is a list of all available contexts.
[
    [
        'label' => 'Request All',
        'name'  => '_event.request',
    ],
    [
        'label' => 'Request Content',
        'name'  => '_event.request.content',
    ],
    [
        'label' => 'Request Content-Type',
        'name'  => '_event.request.content_type',
    ],
    [
        'label' => 'Request Headers',
        'name'  => '_event.request.headers',
    ],
    [
        'label' => 'Request Parameters',
        'name'  => '_event.request.parameters',
    ],
    [
        'label' => 'Request Method',
        'name'  => '_event.request.method',
    ],
    [
        'label' => 'Request Payload',
        'name'  => '_event.request.payload',
    ],
    [
        'label' => 'API Resource',
        'name'  => '_event.resource',
    ],
    [
        'label' => 'Response All (for events only)',
        'name'  => '_event.response',
    ],
    [
        'label' => 'Response Status Code (for events only)',
        'name'  => '_event.response.status_code',
    ],
    [
        'label' => 'Response Content (for events only)',
        'name'  => '_event.response.content',
    ],
    [
        'label' => 'Response Content-Type (for events only)',
        'name'  => '_event.response.content_type',
    ],
    [
        'label' => 'Platform All',
        'name'  => '_platform',
    ],
    [
        'label' => 'Platform Config',
        'name'  => '_platform.config',
    ],
    [
        'label' => 'Platform Session',
        'name'  => '_platform.session',
    ],
    [
        'label' => 'Platform Session User',
        'name'  => '_platform.session.user',
    ],
    [
        'label' => 'Platform Session API Key',
        'name'  => '_platform.session.api_key',
    ]
]
Service Event Map
Array. Optional. Here you can tie this service to any number of system events. In the example above we have tied our service with two events - “system.admin.session.post” and “system.admin.session.delete”. These events are fired respectively when a system admin logs in and logs out of the DreamFactory and therefore, it automatically fires this logstash service and sends the log to logstash. We have also selected our Log level and Message for these events. Log Level and Message are optional. If you leave them blank then the default log level is INFO and default message is the full name of the event. If you choose GELF (UDP) for your service protocol/format then log level is going to be the standard numeric value of GELF syslog. For all other protocol (HTTP, TCP, UDP) the log level is the standard numeric value of Monolog.
   Level       GELF Syslog value   Monolog value
   EMERGENCY   0                   600
   ALERT       1                   550
   CRITICAL    2                   500
   ERROR       3                   400
   WARNING     4                   300
   NOTICE      5                   250
   INFO        6                   200
   DEBUG       7                   100
ElasticSearch
This is where the hard work of the stack is done. You configure the Logstash connector to listen for inputs, and then those data points are pushed into the "heart" of the stack. This is where your data is stored
Coming Soon
Kibana
Coming Soon
Connection Resources
Configuring ELK in AWS
Configuring an ELK stack on AWS is very straightforward. It takes less time than a traditional ELK stack set up as you do not need to isntall each component separately. You just spin up the instance, and it will add a Kibnana link for you to expose the data visually.
